
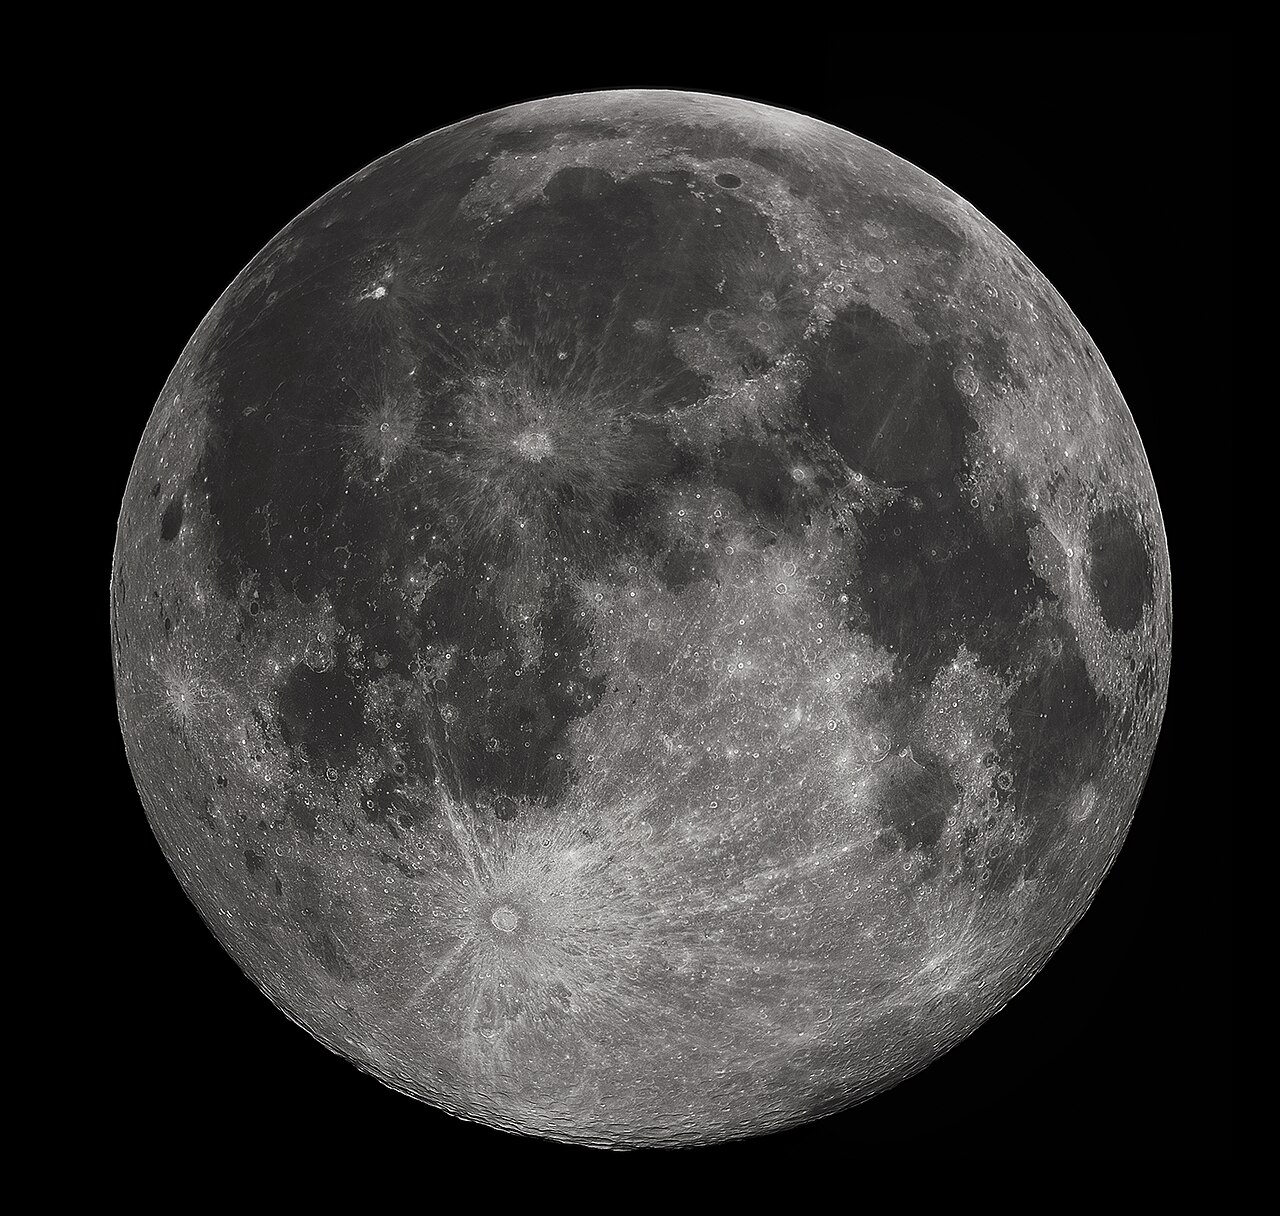
Every school physics textbook carries the same diagram: the Earth wearing two watery bulges, one facing the Moon and one opposite, with the planet spinning beneath them to give two high tides a day. The diagram explains why tides exist. It cannot explain a single actual tide table, and the ways it fails are more interesting than the picture itself.
Start with what the diagram gets right. The Moon's gravity pulls harder on the near side of the Earth than on the far side, and it is this difference — the tide-generating force — that matters, not the raw pull. The differential stretches the ocean along the Earth-Moon line, and because the Sun produces a similar effect at about 46 per cent of the Moon's strength, the two either stack (spring tides, near new and full moon) or partially cancel (neaps, near the quarters). So far, so textbook.
Now run the numbers on the bulge. For a hump of water to stay pointed at the Moon while the Earth rotates under it, it would have to sweep around the equator at roughly 1,600 kilometres per hour. A tide is a shallow-water wave, and such a wave's speed is set by depth: in an ocean averaging about four kilometres deep, it can manage only around 700 km/h. The ocean physically cannot keep up with the forcing. Add the continents, which block any bulge from circulating freely, and the equilibrium picture collapses. What the Moon and Sun actually do is shake the ocean basins rhythmically, twice every 24 hours and 50 minutes, and each basin responds like water sloshed in a bathtub — as a set of standing and rotating waves with a life of their own.
That response is organised around amphidromic points: spots in the open sea where the tidal range is essentially zero, around which the crest of the tide rotates like the hand of a clock, once per tidal cycle. The rotation is a Kelvin wave, steered by the Coriolis effect, which in the northern hemisphere presses the wave against the coast on its right. The North Sea alone contains three amphidromic systems, which is why the tide arrives at Aberdeen, Hull and Harwich at quite different times, and why the semidiurnal wave takes most of a day to travel from the north of Scotland down the east coast to the Thames. Around Southampton, the interaction of the main tide with its shallow-water harmonics produces the famous double high water — two peaks a couple of hours apart — a gift to the port that no bulge diagram could ever predict.
Why the Severn roars and the Mediterranean sleeps
Resonance is the missing half of the story. Every basin has natural periods at which water sloshes back and forth, set by its length and depth. If a natural period sits close to the principal lunar period of 12 hours 25 minutes — oceanographers call this constituent M2 — the basin amplifies the forcing, cycle after cycle, like a pushed swing. The Bristol Channel and Severn Estuary form a funnel roughly 200 kilometres long whose sloshing period lies near that mark, and the narrowing, shoaling geometry concentrates the wave's energy further as it runs inland. The result at Avonmouth is a mean spring range of about 12.3 metres, with extremes approaching 14 — the second-largest tidal range on the planet, behind only the Bay of Fundy in Canada. On the biggest springs the leading edge steepens into the Severn bore, a breaking wave that runs upriver past Gloucester with surfers on its back.
The Mediterranean shows the opposite case. It is deep, its sub-basins have natural periods far from 12.42 hours, and it connects to the Atlantic only through the 14-kilometre-wide Strait of Gibraltar, too narrow to let much of the ocean tide in. Ranges of 20 to 40 centimetres are typical, which is why classical civilisations that ringed that sea wrote so little about tides, and why Mediterranean harbours never needed the lock gates that line British ports.

How Britain learned to predict the unpredictable diagram
Because each coastline's response is fixed by geography, tides can be forecast with remarkable precision despite the broken theory behind the school picture. The method, formalised in Victorian Britain by Lord Kelvin, decomposes the record from a tide gauge into dozens of harmonic constituents — M2, the solar S2, and the rest — then recombines them to predict years ahead. Kelvin built brass machines of pulleys and gears to do the summation; their successors are the numerical models run at the National Oceanography Centre in Liverpool, whose tide-gauge network and storm-surge forecasts feed the Environment Agency's flood warnings, and the UK Hydrographic Office in Taunton, whose Admiralty tide tables cover ports worldwide. The bulge diagram survives in classrooms because it answers the first question — why the sea moves at all. Everything a sailor, a surfer or a flood forecaster actually needs comes from treating the tide as what it is: the ocean ringing like a struck bell, at frequencies the Moon supplies but geography chooses.



Join in — free. Comments on Daily Junction are for members, so real names stay rare and bots stay out.
One field. We email you a 6-digit code — no password needed. Your comment is kept while you do it.
Under 13? You’ll need a parent’s OK first — it takes them one click.